Test Plan
A test plan describes a series of steps JMeter will execute when run. A complete test plan will consist of one or more Thread Groups, logic controllers, sample generating controllers, listeners, timers, assertions, and configuration elements.
When you open a Jmeter ,this is how it looks

You can rename the test plan as desired for e.g. API Performance Test
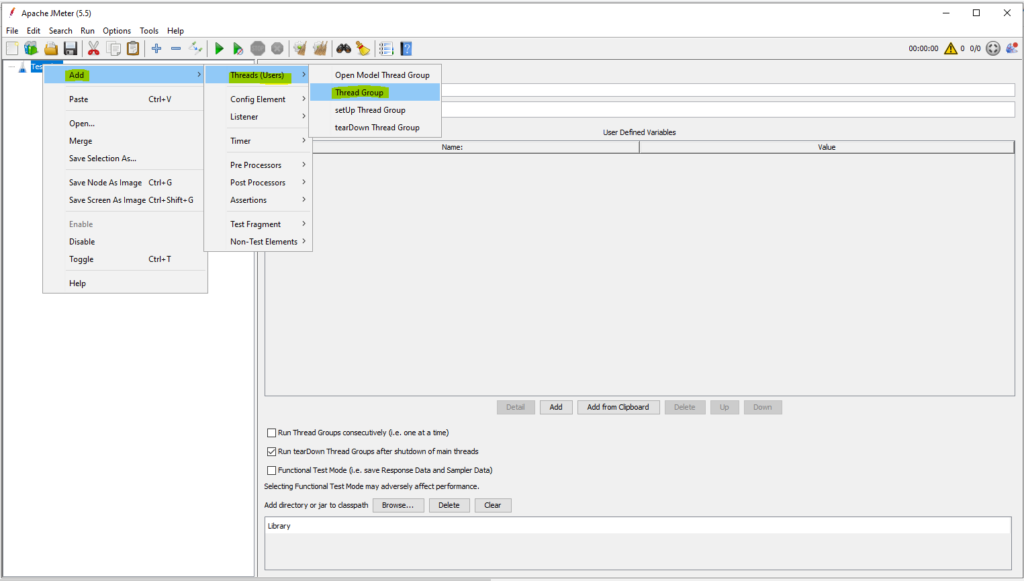
Thread Group
Thread group is the basic element of the Jmeter Test plan. As said in the name, Thread group is a group of threads that are executing the same scenario. This is considered the beginning point of a test plan.
Sampler
Samplers tell JMeter to send requests to a server and wait for a response. They are processed in the order they appear in the tree.
HTTP Request
The JMeter HTTP Request is a sampler that lets you send an HTTP/HTTPS request to a web server for load testing.

Once you add a Sampler , you can rename it to match the functionality like the one below –

There are different methods the sampler is able to use, like:
GET
POST
PUT
HEAD
DELETE
PATCH
OPTIONS
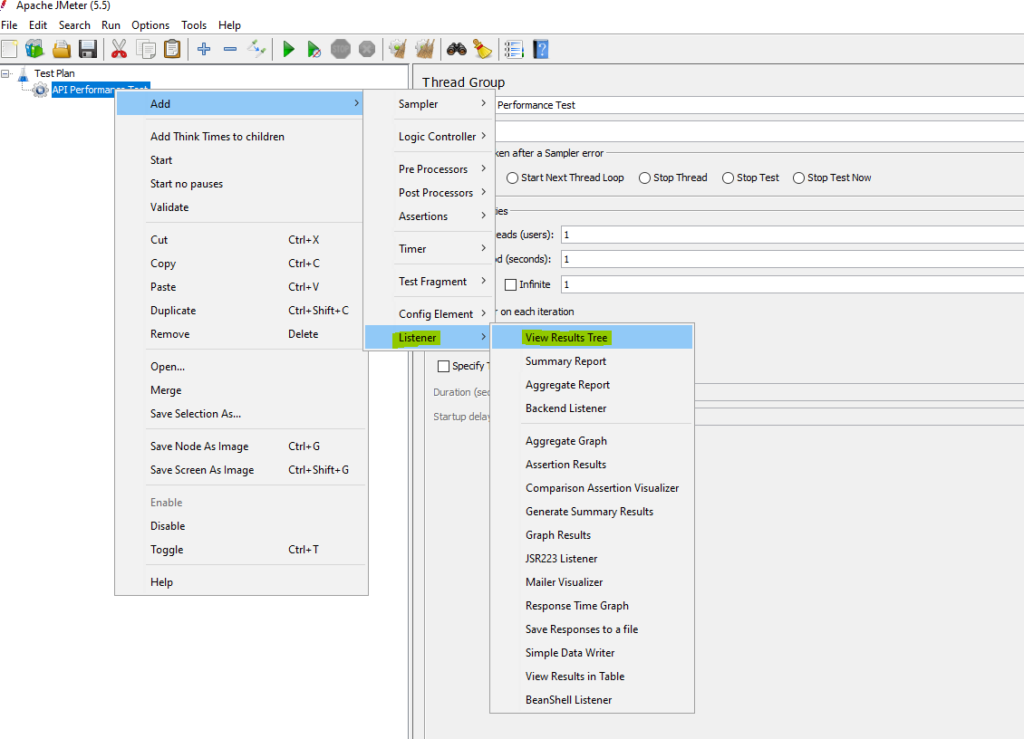
Listeners
A listener is a component that shows the results of the samples. The results can be shown in a tree, tables, graphs or simply written to a log file. To view the contents of a response from any given sampler, add either of the Listeners “View Results Tree” or “View Results in table” to a test plan.
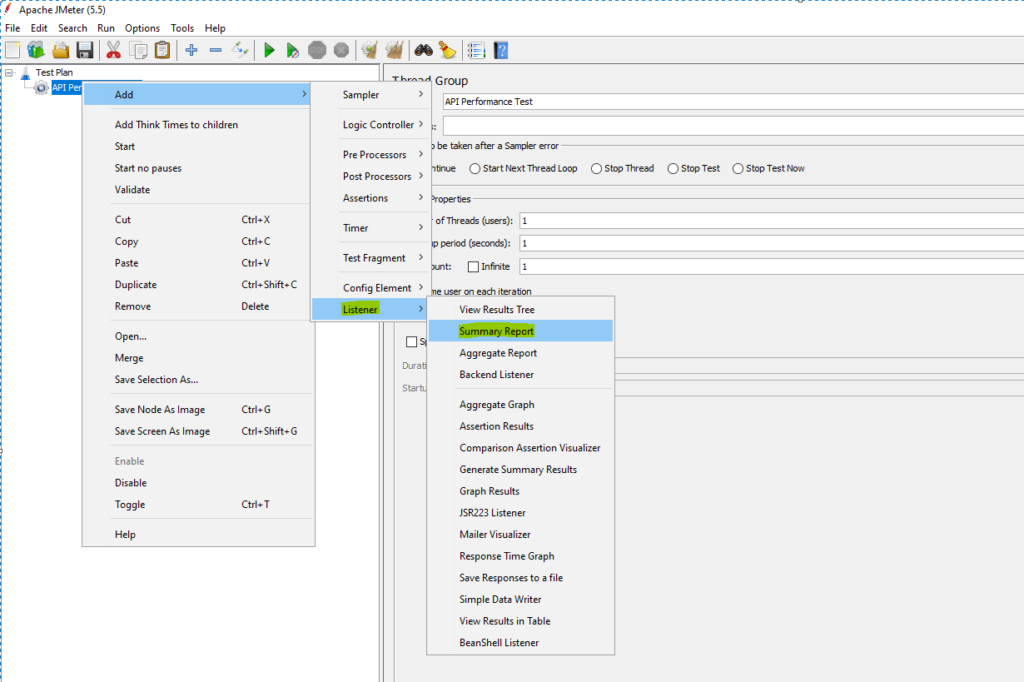
JMeter Summary Report
The Summary Report in Apache JMeter is a listener that provides a summary of the test results, including the overall performance metrics and statistics. It displays the summary data in a table format, showing the average, median, minimum, and maximum values for various metrics such as response time and throughput.
USECASE for Performance Testing –
Consider a functionality of a website that could be used by 1000s of users concurrently and we have to test its performance (response time).
API endpoint we will be using is ‘reqres.in/api/users?page=1‘ and response expected is as seen below. HTTP method is ‘Get’

After completing the Jmeter script ,this is how it will look :

Test Plan named as ‘API Performance Test’.
Thread Group named as ‘Test Performance – ‘Fetch List Of Users”.
Sampler – HttpRequest named as ‘Fetch List of Users’.
Names of the listeners have been retained as is. Also we will not be making any changes to the listeners and use it as is.
Now let me show the details of the Sampler – HttpRequest – ‘Fetch List of Users’

We are performance testing feature – ‘Fetching List Of Users’ and as per the contract with the developer, details are as below:
URL: https://reqres.in/api/users?page=1
HTTP Request method: GET
Response:
Performance Test Objective – Check response time when 1000 users concurrently try fetching list of users and average response time should not exceed 2s and max time should not exceed 5s.
Here:
Protocol: https
Server Name or IP: reqres.in
HTTP Request: GET
Path: /api/users?page=1
Fill above details in the Sampler – HTTP Request – ‘Fetching List Of Users’
This completes our basic script which will execute the functionality ‘Fetching List Of Users’.
But we aren’t doing functional testing here. Our goal is performance testing.
As mentioned above, Thread group is a group of threads that are executing the same scenario.
Let’s make desired changes to the Thread Group named as ‘Test Performance – ‘Fetch List Of Users”.

Since I want this functionality to be executed 1000 times , I am giving number of threads as 1000.
Ramp-up-period am giving as 0 because I don’t want ramp-up ,instead I want all threads to run exactly at the same time.
Now we are good to go ,lets execute our first jmeter script.
To execute the script ,click on this icon

Once the Jmeter script is executed ,this is how the listener – ‘View Results Tree’ looks.

Listener – ‘View Results Tree’ primarily helps us in debugging.
Listener – ‘Summary Report’ gives us statistics like below which helps us assess the performance of the functionality.

Interpreting the above statistics ,When 1000 users ‘Fetch list of users’ concurrently ‘Min’ response time was 99 ms ,‘Max’ response time was 8924 ms (8+ secs) and average response time of all 1000 transaction was 1214 ms which is less than 2s but max time is greater than 5s which is a matter of concern. In such situation talk to the developer and raise a defect accordingly.