Pre-requisite – knowledge of selenium is essential. Please refer this – Selenium Easy
Test Plan
A test plan describes a series of steps JMeter will execute when run. A complete test plan will consist of one or more Thread Groups, logic controllers, sample generating controllers, listeners, timers, assertions, and configuration elements.
When you open a JMeter ,this is how it looks

You can rename the test plan as desired for e.g. UI Performance Test
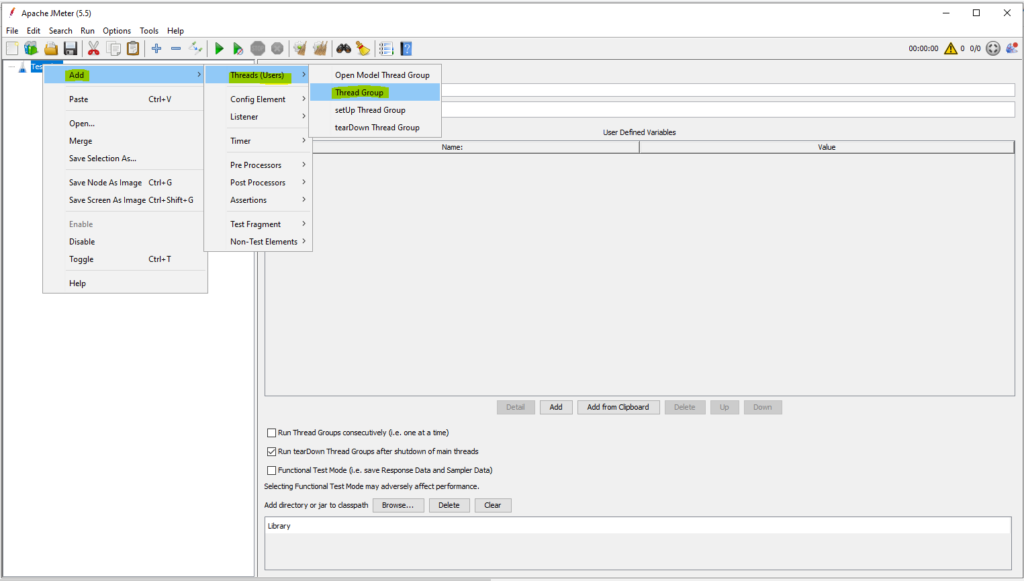
Thread Group
Thread group is the basic element of the Jmeter Test plan. As said in the name, Thread group is a group of threads that are executing the same scenario. This is considered the beginning point of a test plan.
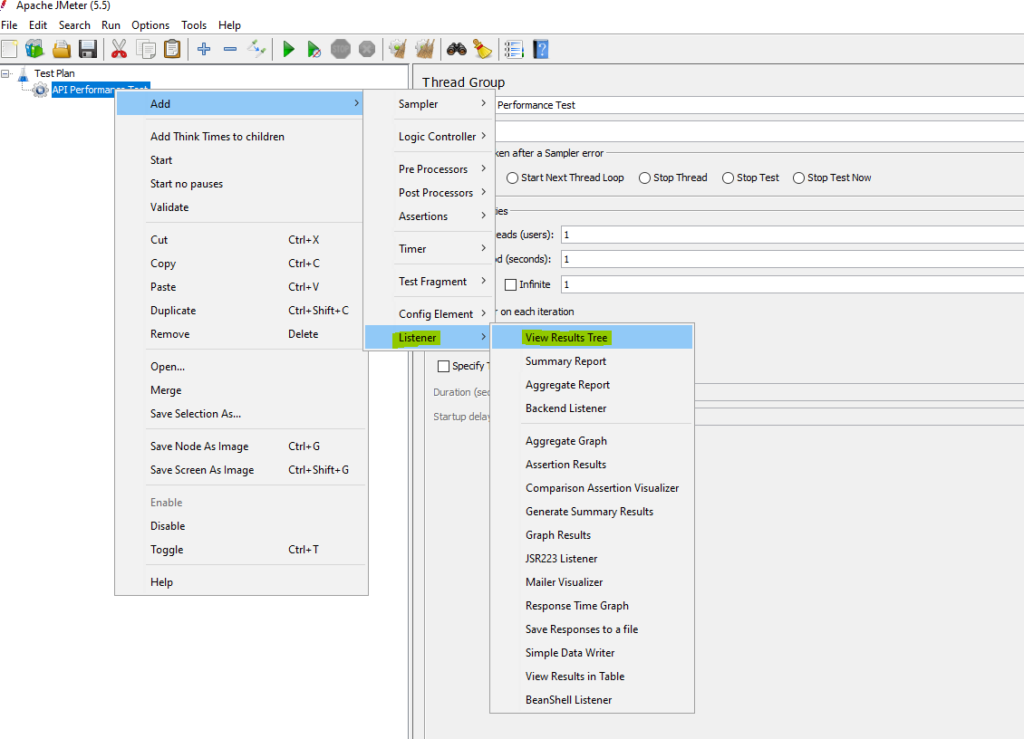
Listeners
A listener is a component that shows the results of the samples. The results can be shown in a tree, tables, graphs or simply written to a log file. To view the contents of a response from any given sampler, add either of the Listeners “View Results Tree” or “View Results in table” to a test plan.
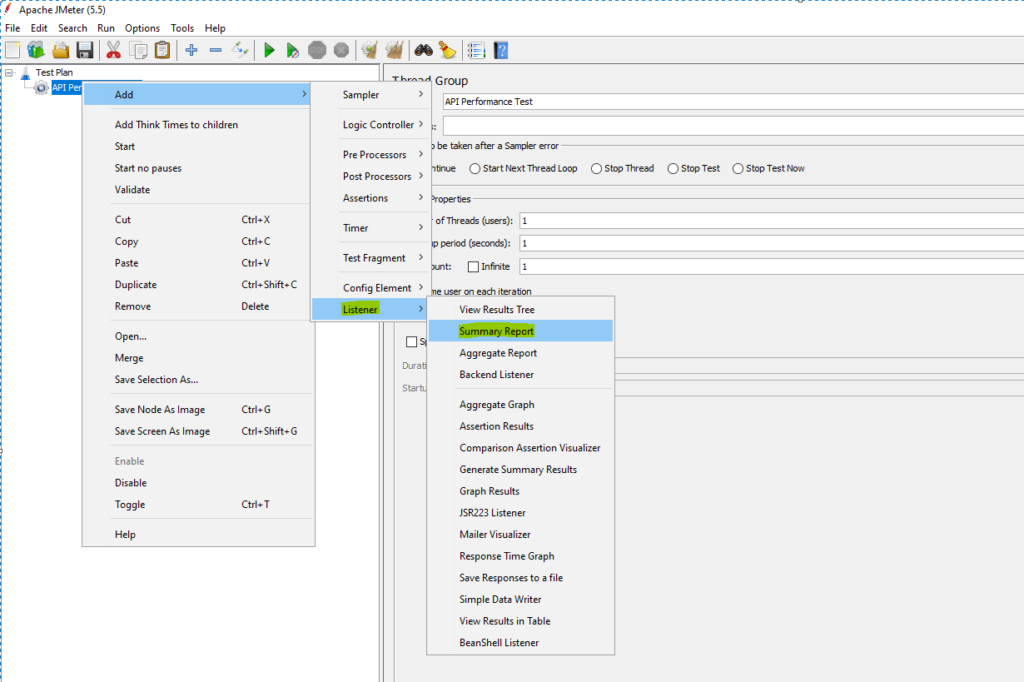
JMeter Summary Report
The Summary Report in Apache JMeter is a listener that provides a summary of the test results, including the overall performance metrics and statistics. It displays the summary data in a table format, showing the average, median, minimum, and maximum values for various metrics such as response time and throughput.
USECASE for UI Performance Testing –
Measure the response time of launching a website ‘https://www.cleartrip.com/flights‘.
First, we will measure the response time for single user and then increase to 2 browsers.
We are taking a simple case because our primary goal here is to learn how to use JMeter for UI performance testing.
Configuration of JMeter for UI Performance Testing – Installation of Web Driver Sampler
Quick Insight into what is Selenium and Web Driver –
Selenium refers to a suite of tools that are widely used in the testing community when it comes to cross-browser testing. Selenium cannot automate desktop applications; it can only be used in browser automation. It supports a number of browsers such as Chrome, Firefox, Internet Explorer, Safari, Opera and operating systems such as Windows, Mac, Linux/Unix.

- Selenium WebDriver is the core component of Selenium which provides a programming interface for driving the web browsers. It allows to write tests in different programming languages to interact with the web elements, simulate user interactions and perform assertions.
- Selenium Grid is a tool that is used for concurrent execution of test cases on different browsers, machines, and operating systems simultaneously. It allows parallel test execution making it faster to run large test suites.
What is Selenium WebDriver?
Selenium WebDriver is a web framework that permits you to execute cross-browser tests. This tool is used for automating web-based application testing to verify that it performs expectedly.
Selenium WebDriver Framework Architecture

How to setup WebDriver for JMeter
Download the appropriate version from here. When you extract the contents, this is what you will see

Copy all the files under jpgc-webdriver\lib to apache-jmeter-5.5\lib

Then copy all the files under jpgc-webdriver\lib\ext to apache-jmeter-5.5\lib\ext
For detailed understanding of using WebDriver with JMeter, please refer to the documentation.
Adding a UI Test to JMeter
After completing the Jmeter script ,this is how it will look :
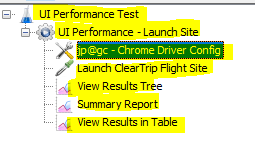
Test Plan named as ‘UI Performance Test’.
Thread Group named as ‘UI Performance – Launch Site’.
Config – Chrome Driver Config. This contains configuration that will be required for WebDriver Sampler.
Sampler – WebDriver Sampler named as ‘Launch ClearTrip Flight Site’.
Names of the listeners – View Results Tree, Summary Report, View Results in Table have been retained. Also, we will not be making any changes to the listeners and use it as is.
How to add Config – Chrome Driver Config to the Thread Group

In the Chrome Driver Config ,following details are provided –

a) Path of the chromedriver.exe (Please download desired version of chromedriver)
b) any other required setting like ‘Maximize browser window’
How to add Sampler – WebDriver Sampler to the Thread Group
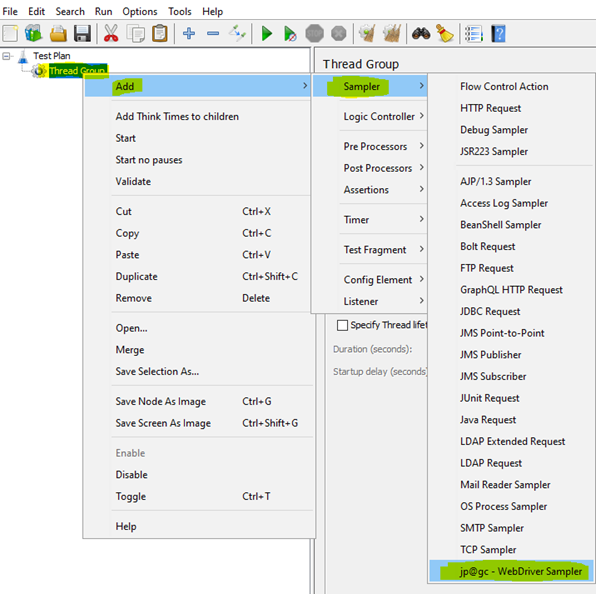

Within the Script section, the Sampler automatically injects a WebDriverScriptable object with the name of WDS
WDS.sampleResult – is used to log when the timing should start and end.
Please refer the documentation for further details.
In this example , site ‘https://www.cleartrip.com/flights’ will be launched using webdriver and response time will be measured using the logger statement ‘WDS.sampleResult.sampleStart‘ and ‘WDS.sampleResult.sampleEnd‘
We will be using this basic script for our demonstration purpose.
We aren’t doing functional testing here. Our goal is performance testing.
As mentioned above, Thread group is a group of threads that are executing the same scenario.
A) Simultaneous launching of clear trip site.
Let’s make desired changes to the Thread Group named as ‘UI Performance – Launch Site’.

Since I want the site to be launched in two browsers, I am giving number of threads as 2.
Ramp-up-period am giving as 0 because I don’t want ramp-up ,instead I want all threads to run exactly at the same time.
Now we are good to go, lets execute our first JMeter UI performance script.
To execute the script ,click on this icon

Once the Jmeter script is executed ,this is how the listener – ‘Listener – ‘Summary Report‘ looks.
Listener – ‘Summary Report’ gives us statistics which helps us assess the performance of the functionality.
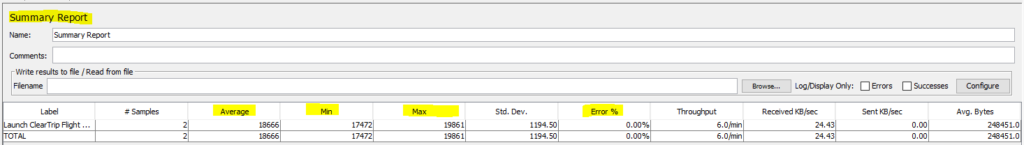
Interpreting the above statistics, when 2 users launch site, ‘Min’ response time is 17,472 ms (17.5 secs),‘Max’ response time is 19,861 ms (near 20 secs) and average response time of 2 transaction is 18,666 ms (near 19 secs).
Now if I test the performance with just 1 user, let make the changes to the thread group as below and then run the script and let us see the statistics than.
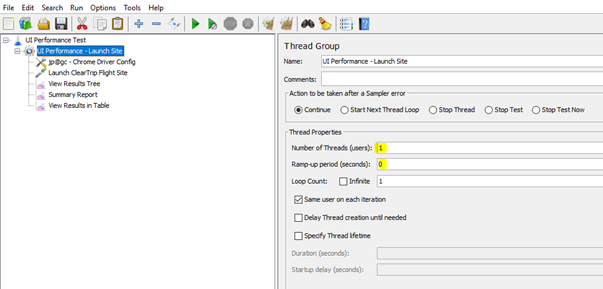
To execute the script after above changes ,click on this icon
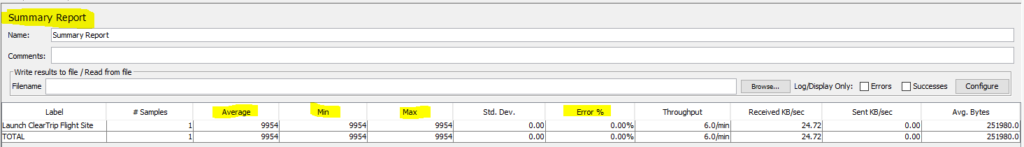
Interpreting the above statistics, with 1 user it takes just takes 9,954 ms (near 10 secs) way low compared to 18,666 ms (near 19 secs) which is the average response time when 2 users opened the site simultaneously.
B) Non-Simultaneous launching of clear trip site.
Now let me see how the site responds when 2 users open the site but with a time gap of 5 secs.
lets make the changes to the thread group as below and then run the script and let us see the statistics than.

To execute the script after above changes ,click on this icon
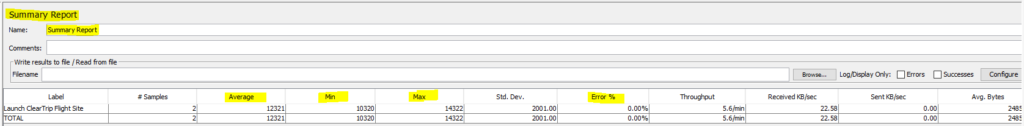
Interpreting the above statistics, when 2 users launch site (now with a ramp up period of 5 secs) , ‘Min’ response time is 10,320 ms (10 secs),‘Max’ response time is 14,322 ms (near 14 secs) and average response time of 2 transaction is 12,321 ms (near 12 secs).
As can be seen there is a difference in response when user opens the site concurrently and non-concurrently.
Well, this blog is only for learning purpose, in reality we will be testing with many more users. Soon I will demonstrate in my new blog how we can use JMeter to perform UI performance test (more no. of browsers) with each user opening browser on different machine.